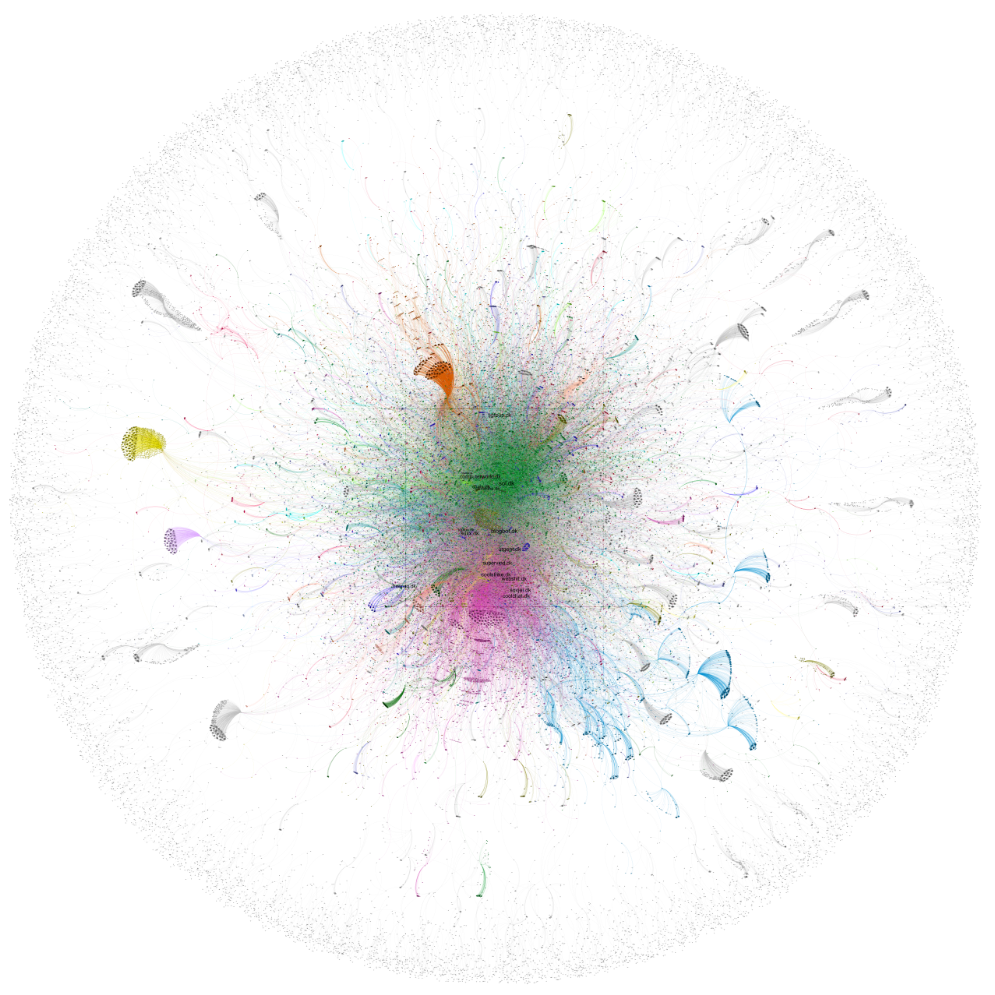
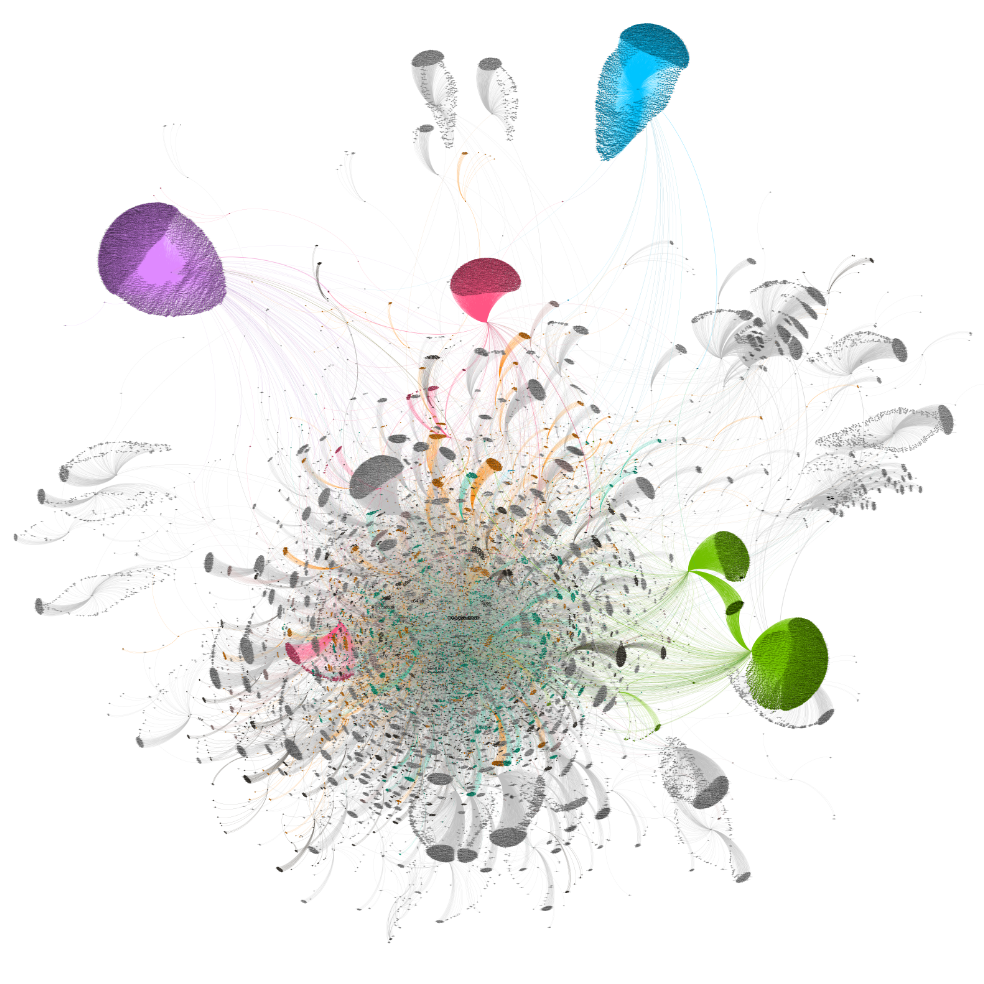
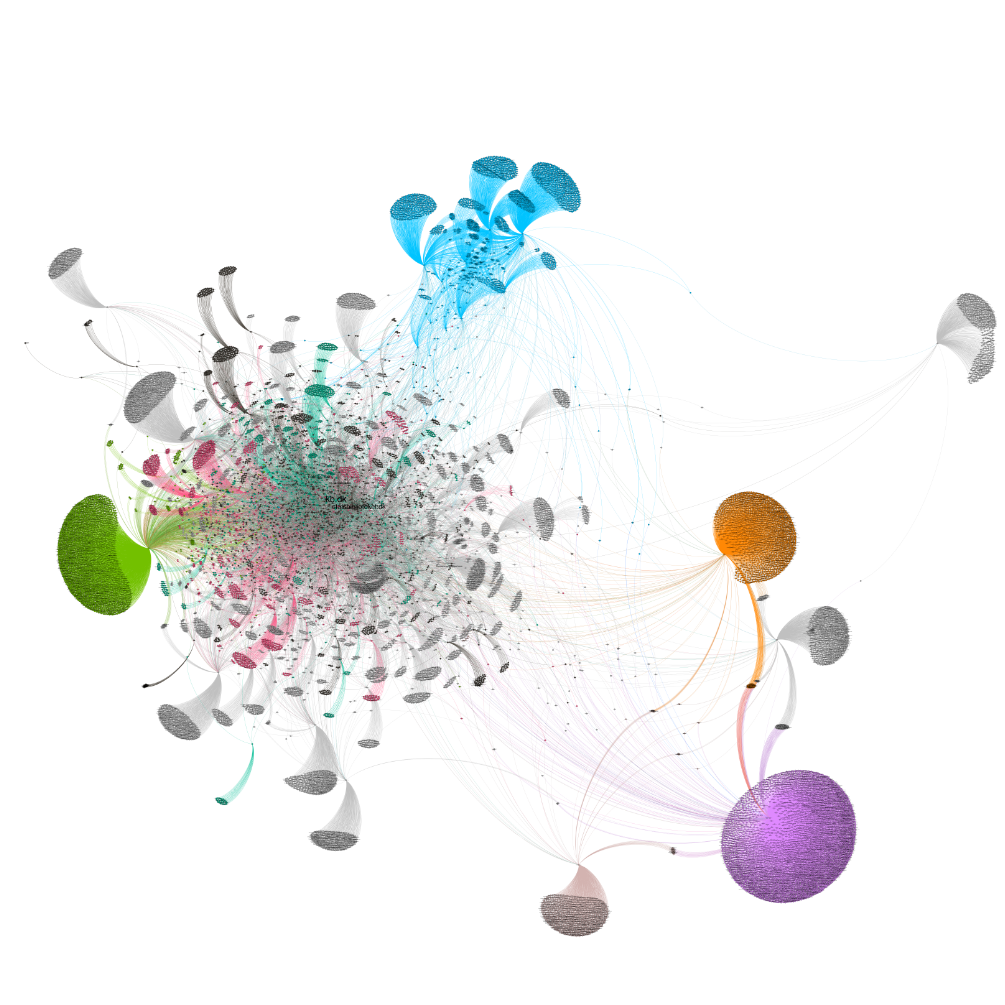
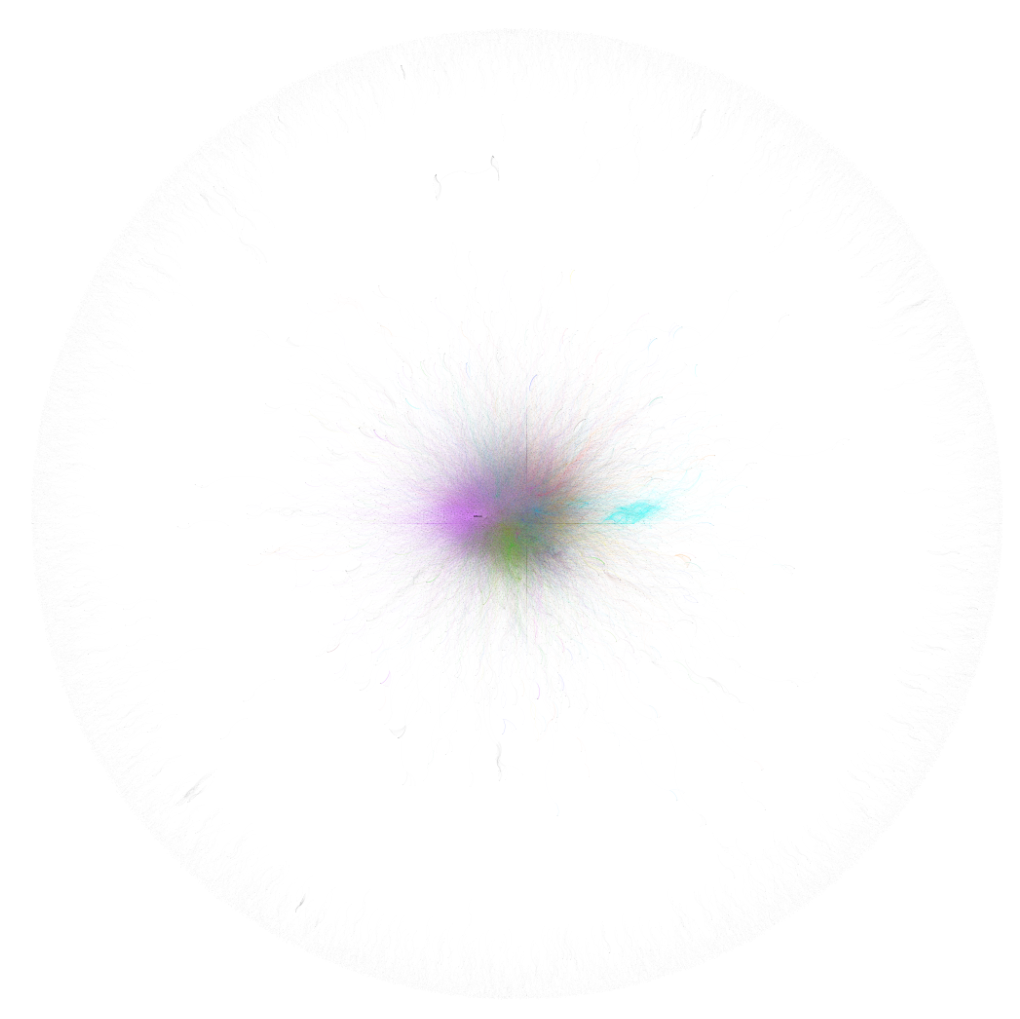
The link graph project aims to visualise links between domains as well as experiment with interactive exploration of such link structure.
There are two main modes for interacting with the visualisation: Search and connect, selected by the drop-down on top of a graph presentation page.
Writing part of a domain name in the input field highlights all the domains that matches the written substring. The zoom & pan is automatically adjusted to show the full amount of matches.
This allows the user to locate specific domains.
Examples:
Clicking on a domain circle dims the full domain cloud and highlights the selected domain along with its in- and out-going links. Clicking extra domains adds to the highlight, clicking outside of domains clears the highlights.
This allows the user to locate linked domains and to create custom visualisations of selected domains.
Examples:
Writing a domain name in the first input field or clicking on a domain selects the source domain. Writing a domain name in the second input field or shift-clicking a domain selects the destination domain. When both source and destination has been specified, the shortest path of links connecting source & destination is visualised (if there is such a path).
This allows the user to examine how close specific domains are connected.
Examples:
![]()
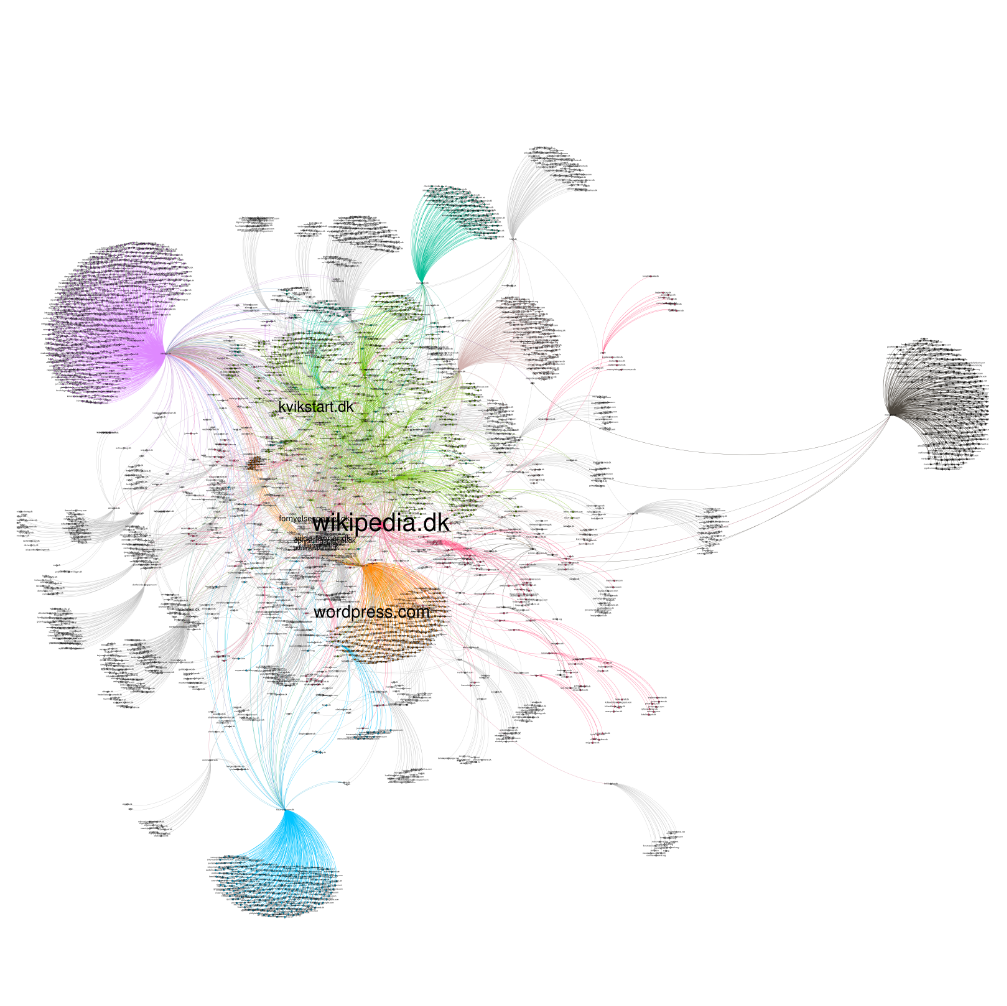
Link graphs extracted from the Danish Internet Archive Netarkivet. This archive contains harvested webpages from 1998 and up to today. The total number of resources in the archive is currently about 28 billion documents. The graphs are released as Creative Commons Attribution-ShareAlike 4.0 International.
The data for the link graph is extraced using SolrWayback. SolrWayback is both a discovery platform for searching in historical webpages and a playback tool for viewing the webpages. It comes with various tools including the link graph export tool.
The link graphs are exported in CSV format which can be imported into Gephi. In Gephi, the data are processed and the link graph is saved in a lossless SVG format. The size of the domain name is determined by how central the domain is in the link graph (betweenness centrality).
This SVG file is then rendered to bitmap image tiles with libvips and displayed with OpenSeadragon. Data for interactive use are extracted from the SVG and used with the presentation using graph_presenter.
Note: As the data structure for the graphs is held in browser memory, graphs with 100K+ domains might not work on tablets or phones.
As can be seen, bookmarking suffers from what looks like a timing issue. That and other issues are tracked at the graph_presenter issues.
We welcome feedback and ideas for future development.